CITIZENS DEVELOPMENT BUSINESS FINANCE PLC
ANNUAL REPORT 2021/22


Chief Financial Officer’s Analysis
GRI 102-7

Damith Tennakoon
Executive Director/Deputy Chief Executive Officer/Chief Financial Officer
Although we were no exception to the impacts and implications of this environment, we managed to maintain the trend of consistently improving performance year on year as we have been doing over the past decade.
We would like to attribute our performance which appears to be better than the industry averages to the strength of our franchise, the resilience of our business model, the soundness of our strategy, the robustness of our risk management framework and the high quality of our customer base.
An overview
Overall, the performance of the Non-Bank Financial Institutions (NBFIs) sector is projected to have recovered during the year compared to the setbacks reported in 2020/21. As at 31 December 2021, NBFI sector recorded a growth in total assets to Rs. 1,487 Bn. or 6.1% compared to Rs. 1,402 Bn. reported as at 31 December 2020. However, the market share of the NBFI sector continued to shrink (5.5% in 2021, 5.9% in 2020 and 7.1% in 2019), a trend that was observed since 2019 that can be attributed to the effects of Easter Sunday attacks and COVID-19.
Based on the interim financials available so far, both loans and advances and total assets of the sector are expected to have recorded double digit growth during the year ended 31 March 2022 while customer deposits continued to dominate the liabilities of the NBFIs accounting for 53% of liabilities. Loans and advances accounted for 75% of the total assets while deposits accounted for 50% of the fund base. Asset quality too appears to have improved leading to a drop in both gross and net NPLs and an increase in provision coverage. Interest margins have been maintained and operational efficiency improved. Consequently, sector is projected to have recorded substantial improvements in profits and profitability. Overall, the sector managed to maintain comfortable levels of capital adequacy and liquidity during the year under review.
Performance of the sector as well as our performance should be read in the context of the volatile, uncertain, complex and ambiguous operating environment that prevailed as elaborated on page 32 of this Annual Report. Although we were no exception to the impacts and implications of this environment, we managed to maintain the trend of consistently improving performance year on year as we have been doing over the past decade. We would like to attribute our performance which appears to be better than the industry averages to the strength of our franchise, the resilience of our business model, the soundness of our strategy, the robustness of our risk management framework and the high quality of our customer base. It is also a manifestation of how serious we have been in our purpose of empowering aspirations of our stakeholders.
A detailed review of our performance is given below.
Business volumes
Loans and receivables
Gross loans and receivables to customers increased by Rs. 4.7 Bn. (6%) YoY to Rs. 83.5 Bn. as at 31 March 2022 from Rs. 78.8 Bn. a year ago. The growth in the lending portfolio mainly came from gold loans which recorded a growth of Rs. 3.9 Bn. or 56%, enabling us to diversify the loan portfolio and improve the short-term assets in the maturity profile.
The unusually higher vehicle prices in the market continued to be a challenge on new leases. Higher prices expose the Company to higher Loan To Value (LTV) ratios which may potentially cause losses in the event the vehicle prices come down during the tenure of such lease agreements. The underlying risk was compounded when we had to underwrite new business at substantially lower interest rates, especially in the first half of the year. Adequate precautions were taken to maintain our exposures at acceptable levels by maintaining our LTV ratio at acceptable levels which was below 70% as of 31 March 2022. Even as the shift from leases for brand new vehicles to leases for registered vehicles continued during the year due to ongoing import restrictions, we experienced unusually high early settlements of leases owing to stress situations experienced by lessees leading to instalments in arrears as well as higher vehicle prices.
Margin Trading and credit card portfolios also have shown considerable progress during the year recording a growth of Rs. 310 Mn. and Rs. 565 Mn., both portfolios witnessing over 50% growth.
Concentration of loan book by assets categories
| Assets category |
|
2021 | ||
| Rs. Mn. | % | Rs. Mn. | % | |
| Motor cars and light vehicles | 43,302 | 51.9 | 43,635 | 55.4 |
| Three wheelers and motorcycles | 18,180 | 21.9 | 17,265 | 21.9 |
| Gold articles | 10,774 | 12.9 | 6,893 | 8.7 |
| Motor lorries and other heavy vehicles | 2,030 | 2.4 | 2,067 | 2.6 |
| Loans against deposits | 1,455 | 1.7 | 1,483 | 1.9 |
| Mini trucks | 688 | 0.8 | 681 | 0.9 |
| Motor buses and motor coaches | 515 | 0.6 | 527 | 0.7 |
| Machineries | 350 | 0.4 | 333 | 0.4 |
| Other | 6,164 | 7.4 | 5,915 | 7.5 |
| Total | 83,458 | 78,799 | ||
Deposits from customers
Our deposit base grew by 7% YoY to Rs. 52,217 Mn. in FY 2021/22 from Rs. 48,999 Mn. in FY 2020/21. The Growth in the deposit portfolio mainly came from time deposits which recorded a growth of Rs. 3,196 Mn. or 7%. It is also evident that average cost of the customer deposits also reduced from 12.56% of five years ago to 7.29% for the current year showcasing the strong deposit brand franchise. The deposits to debt composition decreased from 70% in the previous year to 68% in the financial year under review.
Growth in deposit base and behaviour of average cost
| 2020/21 | 2019/20 | 2018/19 | 2017/18 | ||
| Rs. Mn. | Rs. Mn. | Rs. Mn. | Rs. Mn. | Rs. Mn. | |
| Time deposits | 48,844 | 45,648 | 40,783 | 44,945 | 42,331 |
| Savings deposits | 3,004 | 2,915 | 2,267 | 2,014 | 1,991 |
| Other Deposits – Islamic Finance | 369 | 436 | 256 | 264 | 388 |
| Total deposits | 52,217 | 48,999 | 43,305 | 47,223 | 44,710 |
| Interest cost for Deposits | 3,809 | 4,283 | 5,171 | 5,756 | 4,856 |
| Average cost (%) | 7.29 | 9.28 | 11.42 | 12.52 | 12.56 |
Income
Fund-based income
Net interest income for the period increased by 19% to Rs. 9,038 Mn. in 2021/22 from Rs. 7,595 Mn. in the previous year. This was consequent to the higher decrease of 15% YoY in interest expense by Rs. 1,126 Mn. compared to the 2% increase in interest income. Consequently, NIM improved to 9.05% for the year from 8.10% a year ago.
Our interest-earning assets as a percentage of total assets amounted to 90% as of 31 March 2022 compared to 89% as of 31 March 2021, while interest-bearing liabilities as a percentage of total liabilities amounted to 94% as of 31 March 2022 compared to 94.50% as of 31 March 2021. Interest earning assets to interest-bearing liabilities was maintained at around 115%. (2020/21 - 110%)
Fee-based income
Fee-based income from fees and commissions recorded a decrease of 23% YoY to Rs. 311 Mn. from Rs. 406 Mn. in FY 2020/21. Low business growth in vehicle related lending caused the reduction in fees and commission income. However, other operating income increased by 54% to Rs. 2,067 Mn. from Rs. 1,339 Mn. in the previous year. The increase is mainly attributed to the rise in pre closures of the lending contracts.
Growth in net interest income coupled with the increase in other operating income contributed to the 22% increase in total operating income to Rs. 11,415 Mn. for the year from Rs. 9,340 Mn. in FY 2020/21.
Operating expenses
Total operating expenses swelled by 15% YoY to Rs. 4,412 Mn. from Rs. 3,830 Mn. in FY 2020/21. The increase was mainly due to staff-related expenses that increased by 26% in the year under review, mainly driven by inflationary pressures.
Nevertheless, the higher growth in operating income compared to the increase in operating costs resulted in the cost to income ratio (excluding taxes on financial services) for the year under review decreasing to 38.65% from 41.00% in 2020/21.

Asset quality and impairment provisioning
Our lending portfolio accounts for 75% of the total assets on average. Therefore, the quality of our assets portfolio depends heavily on the quality of the lending portfolio.
Of the total lending portfolio, 83% accounted for vehicle related lending whilst 13% accounted for gold related lending. Due to the abnormally high vehicle prices, the vehicle related lending undergoing stress conditions about their payments opted to dispose of their vehicles and settle the lending contracts.
During the year, the growth in the loan book was mainly driven by gold loans which is a relatively safe asset class generating higher yields. Exemplifying the success of our strong recovery mechanism and focus on expanding our exposure to less risky asset classes, the quality of our portfolio continued to improve further during the year. Accordingly, the NPA ratio (gross) reduced by 111 bps YoY to 5.89% in 2021/22 from 7.00% last year, and the NPA ratio (net) reduced by a phenomenal 210 bps to 0.11% in the year under review from 2.21% in 2020/21. This is a noteworthy achievement considering the significant deterioration in asset quality in the NBFI sector.
As a result of the improvement in asset quality, the impairment provision for the year decreased to Rs. 1,195 Mn. compared to Rs. 1,422 Mn. last year. Provision cover too improved accordingly from 69.12% in 2020/21 to 98.31% in the current year compared to the sector average of 65%. The open credit exposure ratio came down to 27.28% as of 31 March 2022 from 38.52% a year ago.
Asset quality and impairment provision
| 2020/21 | 2019/20 | 2018/19 | 2017/18 | ||
| NPA ratio (gross) (%) | 5.89 | 7.00 | 7.54 | 6.68 | 3.07 |
| NPA ratio (Net) (%) | 0.11 | 2.21 | 4.24 | 3.84 | 0.89 |
| Impairment provision (Rs. Mn.) |
4,733 | 3,741 | 2,667 | 2,064 | 1,336 |
| Provision cover (%) | 98.31 | 69.12 | 49.34 | 44.12 | 71.60 |
| Open credit exposure ratio (%) | 27.28 | 38.52 | 47.55 | 51.54 | 21.22 |
Exemplifying the success of our strong recovery mechanism and focus on expanding our exposure to less risky asset classes, the quality of our portfolio continued to improve further during the year.
Except for the 2.58% of personal loans and credit card portfolio, the rest of the lending portfolio is asset-backed with a relatively lower LTV ratio. As a result, our LGD is relatively lower. Historically our loss rates have continued to be significantly lower compared to the industry. Our NIM was 9.05% in 2021/22 which makes a statement about the risk profile of our customer base.
All the above factors combined contributed to the decrease in the impairment provision for the year compared to the previous year.
Stage-wise breakdown of the lending portfolio and the impairment provision
| Product | Stage 1 12 months ECL | Stage 2 Lifetime ECL - Not credit impaired | Stage 3 Lifetime ECL – Credit impaired | Total |
| Rs. Mn. | Rs. Mn. | Rs. Mn. | Rs. Mn. | |
| Gross loans and receivables to customers | 72,050 | 6,594 | 4,814 | 83,458 |
| Expected credit loss allowance | (1,335) | (702) | (2,696) | (4,733) |
| Net loans and receivables to customers | 70,715 | 5,892 | 2,118 | 78,725 |
Performance of loans under moratoria
During the first round of the moratorium announced by the Central Bank of Sri Lanka in March 2020, we extended deferment of installments for over 90% of the contracts/lending portfolio even without a request from the borrowers. Furthermore, over 90,000 customers were extended the moratorium over the past two years. At the end of the financial year under review, I am happy to state that only about 9,100 contracts with an exposure of Rs. 2.4 Bn. remain from the 11,000 contracts under moratoria at the beginning of the financial year, indicating the satisfactory repayments made by customers. Approximately, 40% of the contracts that have become non-performing have been fully provided for, making the provision coverage 100% of NPLs.
A detailed analysis of the loan portfolio that went under moratorium is given below.
Regulatory Direction Circular No. 4 of 2020 – Debt Moratorium for COVID-19 affected businesses and individuals
Moratorium Type - Instalment payment deferment
| Number of months that instalments had been deferred | Number of facilities | Exposure Rs. Mn. | Percentage of moratorium exposure |
| Two months | 33,366 | 24,762 | 43 |
| Three months | 43,272 | 25,188 | 44 |
| Four to six months | 5,970 | 7,430 | 13 |
| Total | 82,608 | 57,380 | 100 |
2nd Moratorium
Circular No. 11 of 2020 Debt Moratorium for COVID-19 affected businesses and individuals
Moratorium Type – Concessionary rate new facility for unpaid instalments
| Moratorium type | Number of facilities | Exposure Rs. Mn. | Percentage of moratorium exposure |
| Moratorium Loans | 10,991 | 1,724 | 100 |
3rd Moratorium
Circular No. 06 of 2021 and Circular No. 11 of 2020 Debt Moratorium for COVID-19 affected businesses and individuals
Moratorium Type – Instalment Payment Deferment
| Number of months that instalments had been deferred | Number of facilities | Exposure Rs. Mn. | Percentage of moratorium exposure |
| Up to 3 | 25,385 | 17,265 | 72 |
| 3 to 5 | 7,760 | 5,154 | 22 |
| 6 and above | 5,827 | 1,511 | 6 |
| Total | 38,972 | 23,930 | 100 |
4th Moratorium
Circular No. 09 of 2021 Debt Moratorium for COVID-19 affected businesses and individuals
Moratorium Type – Concessionary rate new facility for unpaid instalments or restructuring
| Moratorium type | Number of facilities | Exposure Rs. Mn. | Percentage of moratorium exposure |
| Moratorium loan | 2,382 | 452 | 26 |
| Restructuring | 1,069 | 1,262 | 74 |
| Total | 3,451 | 1,714 | 100 |
Status of the lending portfolio that were granted moratorium, as of 31 March 2022
| Status of the facilities | Number of facilities | Exposure Rs. Mn. | Percentage of moratorium exposure |
| Performing facilities | 47,484 | 33,225 | 53 |
| Fully settled lending facilities | 40,840 | 24,223 | 39 |
| Lease assets acquired by the company | 1,830 | 1,120 | 2 |
| Non-performing (over 6 months) |
5,388 | 4,068 | 6 |
| Total | 95,542 | 62,636 | 100 |
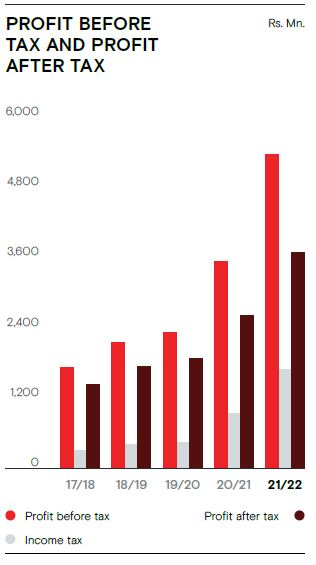
Profitability
Operating profit before taxes on financial services for the year swelled by 42% to Rs. 5,808 Mn. in 2021/22 from Rs. 4,089 Mn. in the previous year. The increase is attributable to the 19% increase in net interest income, 54% increase in other operating income, and the 16% decrease in impairment charges and other credit losses on financial assets. Value added tax and other taxes decreased by 13% YoY to Rs. 540 Mn. As a result, profit before tax increased by 52% for the year to Rs. 5,268 Mn. from Rs. 3,467 Mn. in FY 2020/21. Income tax expense increased by 82% to Rs. 1,656 Mn. compared to Rs. 910 Mn. in FY 2021/22. Consequently, CDB recorded a profit after tax of Rs. 3,612 Mn. for the year under review as against Rs. 2,557 Mn. in 2020/21; an increase of 41% YoY. Earnings per share increased to Rs. 51.75 from Rs. 36.64 in the previous year.
The higher increase in profit after taxation (41%) compared to the relatively lower growth in equity (26%) and total assets (12%) during the year led to significant improvements in profitability. Accordingly, both Return on Average Assets (after-tax) and Return on Average Equity increased to 3.62% and 22.79% respectively for the year compared to 2.73% and 19.97% reported in 2020/21.
Liquidity
We continued to maintain liquidity levels above the regulatory minimum and the stringent ALCO targets during the year. The fact that ours is a very liquid asset portfolio with over 90% of the lending portfolio being contracts with monthly instalment repayments contributed to maintain liquidity at comfortable levels along with low assets liability maturity mismatches.
Asset liability mismatch based on contractual maturities versus behavioural maturity patterns
| Up to 1 year | 1 – 3 years | 3 – 5 years | Over 5 years | Unclassified | |
| Rs. Mn. | Rs. Mn. | Rs. Mn. | Rs. Mn. | Rs. Mn. | |
| Based on contractual maturities (Assets – liabilities) | (3,053) | 5,113 | 2,990 | 3,901 | (8,951) |
| Based on behavioural maturities (Assets – liabilities) | (5,617) | 4,262 | 9,525 | 1,302 | (9,473) |
Capital
We have continued to improve our capital adequacy ratios over the past several years and we are in a comfortable position today in meeting even higher capital adequacy requirements stipulated under guidelines on the Sector Consolidation and the Prompt Corrective Action of the Central Bank of Sri Lanka. The growth in the gold loans portfolio, as well as growth in overall risk-weighted assets being limited to 3% during 2021/22, had positive impacts on capital adequacy. Our capital augmentation plan is in tandem with our plans for expansion of business and the risk profile of our business.
Capital Adequacy Ratios
| 2020/21 | 2019/20 | 2018/19 | 2017/18 | ||
| % | % | % | % | % | |
| Core capital ratio | 15.16 | 12.10 | 10.25 | 8.09 | 10.64 |
| Total capital ratio | 17.07 | 15.34 | 13.29 | 11.07 | 13.93 |
Shareholder returns
We declared a dividend for 2021/22 of Rs. 3.75 per share which is 50% of the dividend declared in the previous year, in compliance with the directions of the CBSL. Market Prices of both voting and non-voting shares recorded substantial increases during the year, thereby increasing the Company market capitalisation to Rs. 14,623 Mn. from Rs. 7,283 Mn. a year ago. Accordingly, market prices of voting and non-voting shares were at Rs. 230.75 and Rs. 110 as of 31 March 2022 and Rs. 86.10 and Rs. 71.90 as of 31 March 2021. Appreciation of the prices by 110% and 20% respectively for voting and non-voting shares compares well against the increase in the ASPI index during the year of 25%.
Outlook for 2022 and beyond
At the time of writing this review, our Nation is facing the most significant economic, political, and social challenges in its history. The deteriorating external financing position combined with the record depreciation of the rupee, unprecedented rates of inflation and the shortage of essential commodities have placed Sri Lanka in a very grave situation. However, the positive developments in relation to the engagement with the International Monetary Fund (IMF) and supportive nations to secure bridge funding and prepare for restructuring of the country’s foreign debts provide hope of economic revival in due time. The unprecedented policy rate hike of 700 basis points effected by the CBSL to curtail inflation and support the currency has created a high-interest rate regime, which is likely to increase pressure on the funding cost as well as asset quality of financial institutions. In such a scenario, growing the lending portfolio while managing our interest margin and asset quality will be challenging due to the high cost of borrowing. Further, in line with the new CBSL regulations, NBFI sector commenced the classification of loans into NPLs based on 120 days past due with effect from 1 April 2022 as opposed to 180 days past due adopted earlier which is also expected to cause an increase in the NPLs reported in the ensuing year.
However, we will prepare for the challenges ahead, capitalising on our innovation and technology and business acumen to deliver value for our stakeholders. More emphasis will be given to growing products that are fully collateralised and repriced at a shorter interval. Through cost efficiencies, effective management of NPLs and topflight customer experiences, we will continue to drive profitability and deliver earnings growth and shareholder returns.

Damith Tennakoon
Chief Financial Officer
17 June 2022
Colombo